- Home
- Features
Features
Need some advice about how to get the best out of Quendix? Contact our support team by one of the following methods.
Amazing reports & Dashboards
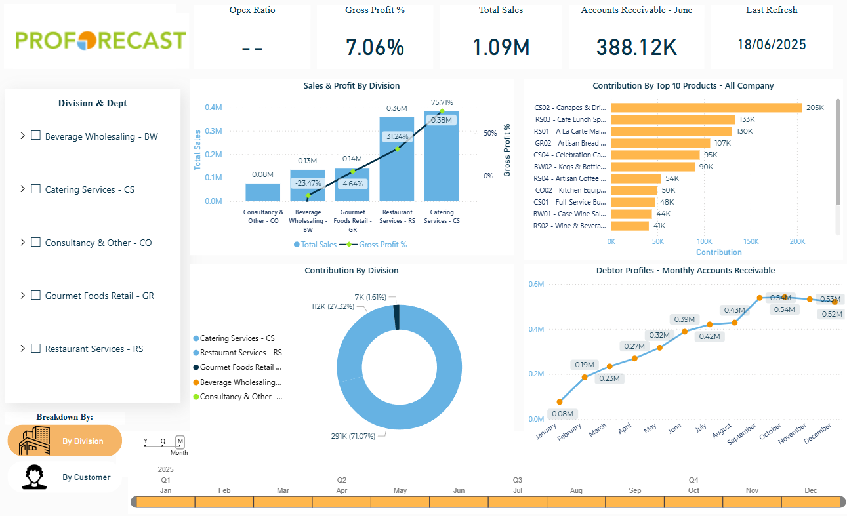
🟩 Dashboard & Report – Ready outputs for immediate integration.
🟩 Customizable Reports – Reports can be tailored to user needs, offering relevant and specific data views for better understanding, Monthly, Quarterly, Variance, & Rolling Reports with Drill Downs
🟩 Interactive Dashboards – Dashboards provide interactive visualizations that enable users to explore data dynamically and gain insights.
🟩 Timely Decision-Making – Clear insights from reports and dashboards support timely and informed decision-making processes.
🟩 Power Bl , Quendix’s Data Visualisation Layer enables you to drill down and gain insights into the performance of your business at the lowest level of granularity that your accounting data allows.
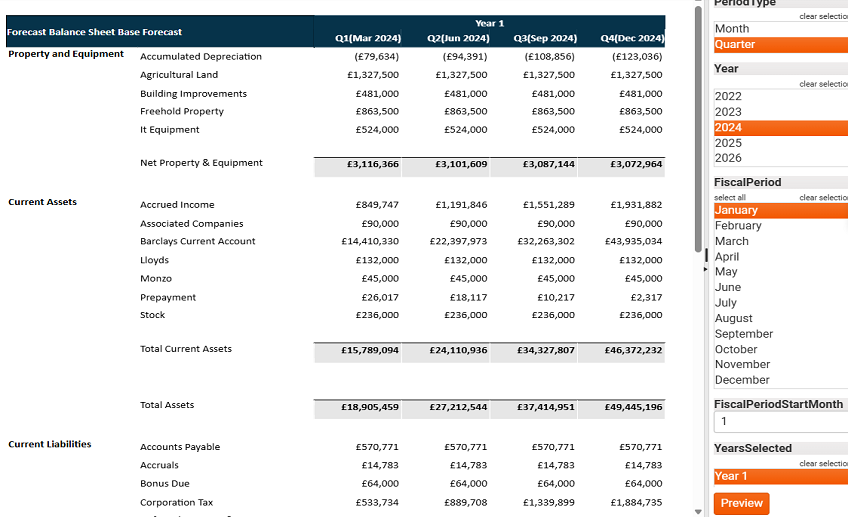
🟩 Rolling Forecast’s – Produce a living forecast based on real data as the forecasting period unfolds and benchmark performance against your annual or long-term budgetary forecast.
🟩 Actual & Variance Reports – Switch instantly from a rolling forecast to an actual variance report using overhead groups to drill down for a highly granular analysis.
🟩 Over 120 pre-built KPI’s with new dashboards and KPI’s easily added.
Unleash the Financial Reporting Capabilities of Your Accounts Package with PowerBI & ProForecast
Empower your stakeholders with a combination of simplicity for non-technical users and the ability to advance into exactly the level of detail they need in the dashboarding realm.
Advanced Interactive Dashboards
When more advanced custom requirements emerge, ProForecast offers an industry-leading BI solution:
🟩 Leverages Power BI technology working on top of our specialized BI layer.
🟩 Work with our highly efficient BI team who would work dedicatedly to understand your requirements and pain points to deliver highly tailored and efficient BI solutions.
🟩 Utilizes the most advanced visualization and analytical capabilities available in modern BI technology.
🟩 Create all your dashboards in one unified place, whether for budgeting, forecasting, or any other business function, all integrated within a single BI layer for seamless analysis.
🟩 The YOY Comparisons dashboard displayed above is an example of such highly advanced adhoc development ProForecast can implement for you.

Collingwood Building, 38 Collingwood Street, Newcastle Upon Tyne, NE1 1JF, United Kingdom
Email at
support@quendix.net
Subscribe to our newsletter
Copyright © 2026 Quendix All rights reserved.